
3.8 KiB
Overview
For my personal self-hosted infrastructure I found the typical Prometheus and Grafana set up to be too bloated, involving too much overhead for what I actually want to monitor
Consequently I decided to build my own lightweight tooling with Python, Bash, SSH, Cron, JSON, HTML/CSS and Javascript
It is capable of sending offline/healing alerts via email, as well as scraping relevant metrics, (CPU, RAM, Disk Space etc), to display on a centralized webpage
The metrics page, as well as the generated JSON files and Python script is hosted on my Apache-Intranet LXC Container
The remote server set-up, including creating the monitoring user, installing required software, copying the Python script and adding ssh keys, is fully automated via Ansible playbooks
Adding a new server to be monitored is easily achieved via the porygon-management.sh CLI tool written in Bash
High Level Architecture Overview
Cron starts scraper.py every 15 minutes
                ↓
       For each monitored server
                ↓
     Attempt to reach via ICMP
          /             \
     SUCCESS             FAILURE
        ↓                   ↓
Check previous state      Check previous state
        ↓                   ↓
 Previously offline?      Previously online?
   /          \              /            \
 YES           NO           YES            NO
  ↓             ↓            ↓              ↓
Send "back      Continue    Send           Continue
online" email              "offline" email
     \         /              \           /
      └───────┬───────────────┴──────────┘
                  ↓
         If server is pingable
                 ↓
   Connect via dedicated SSH key
        as restricted user
                 ↓
   Run collector.py to scrape metrics
                 ↓
       Collector generates JSON
                 ↓
        Copy JSON back via SFTP
                 ↓
Store in appropriate Apache server directory
                 ↓
          index.html reads JSON
                 ↓
       Metrics displayed in web portal
                 ↓
Save current online/offline server state to JSON
Monitoring Failover
I have a secondary Debian LXC container on a separate hypervisor host to provide monitoring redundancy
It is scheduled via Cron to attempt to ping Apache-Intranet every 5 minutes
If Apache-Intranet, (the primary), is unreachable it takes over monitoring/alerting duties, otherwise it lies dormant
Its purpose is to provide email alerts to me informing that we are currently in the midst of an outage and which servers are offline
┌──────────────────────────────────────────┐
│       Secondary Monitoring LXC           │
│    Runs ping.py every 5 minutes which    │
│ checks Apache-Intranet's health via ICMP │
└──────────────────────────────────────────┘
                │
      Is primary reachable?
      /          \
    YES            NO
     ↓              ↓
  Do nothing      Take over
                    ↓
             Begin monitoring servers' reachability
                   and sending alerts
Images

(A green cicle indicates online, a black offline)
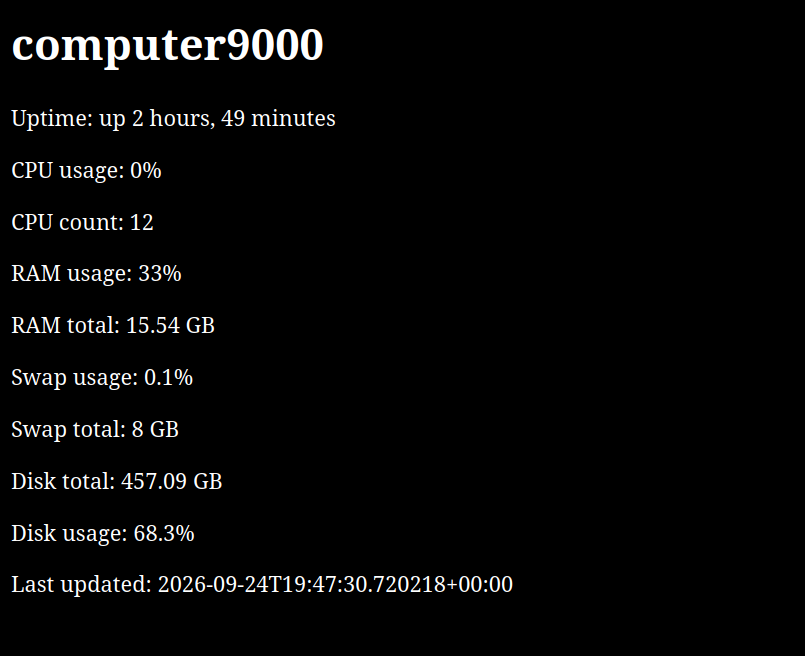
(Example of metrics gathered and displayed page)
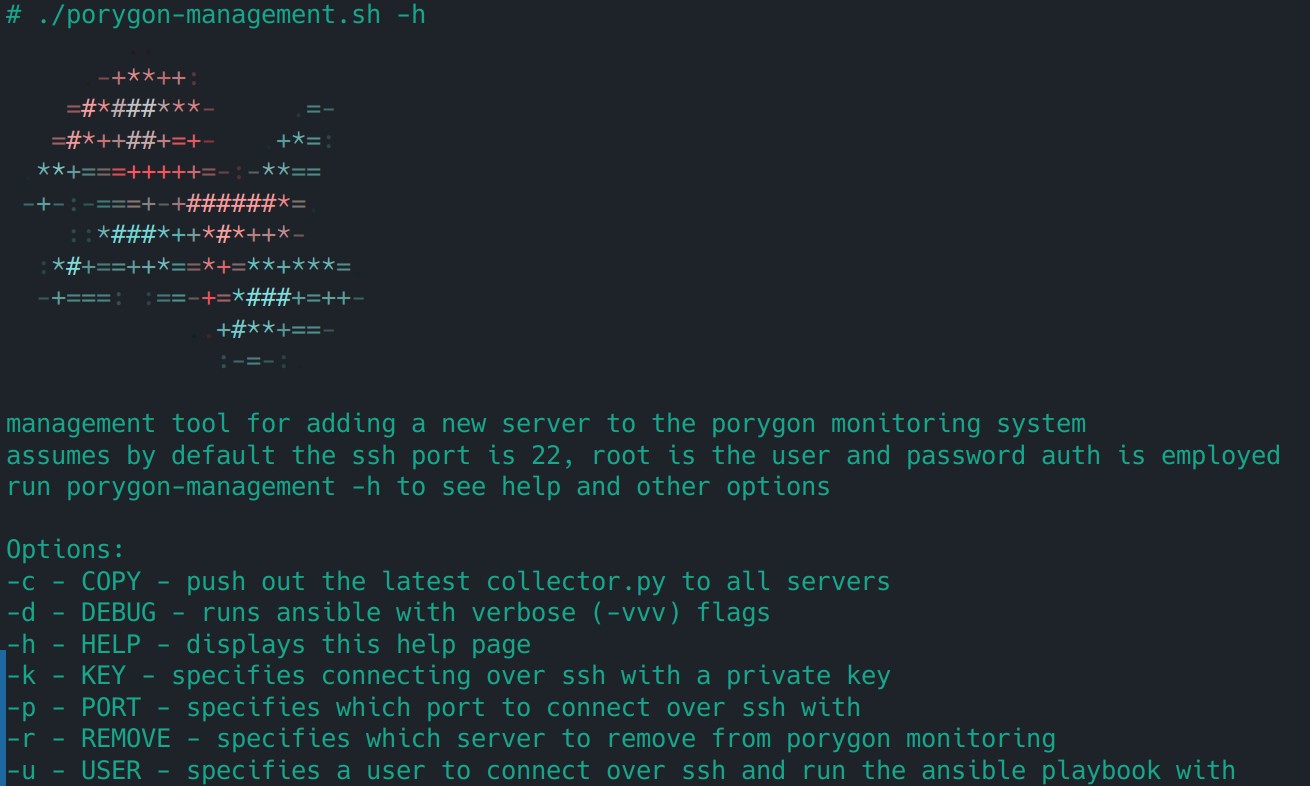
(CLI interface for porygon-management tool written in Bash)