
92 lines
3.6 KiB
Markdown
92 lines
3.6 KiB
Markdown
## Overview
|
|
|
|
For my personal self-hosted infrastructure I found the typical Prometheus and Grafana set up to be too bloated, involving too much overhead for what I actually want to monitor
|
|
|
|
Consequently I decided to build my own lightweight tooling with Python, Bash, SSH, Cron, JSON, HTML/CSS and Javascript
|
|
|
|
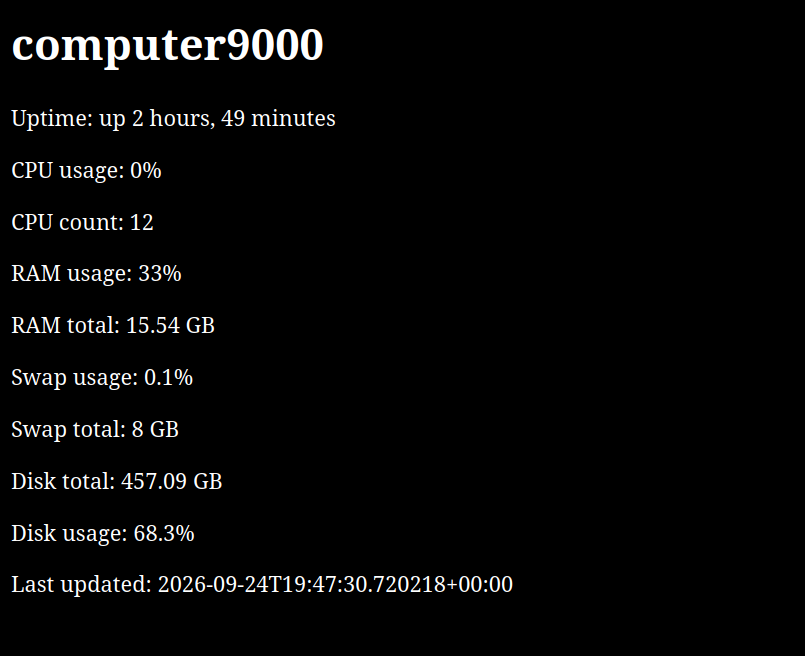
It is capable of sending offline/healing alerts via email, as well as scraping relevant metrics, (CPU, RAM, Disk Space etc), to display on a centralized webpage
|
|
|
|
The metrics page, as well as the generated JSON files and Python script is hosted on my [Apache-Intranet LXC Container](https://git.tobiastime.xyz/Tobias/Apache-LXC-Intranet)
|
|
|
|
The remote server set-up, including creating the monitoring user, installing required software, copying the Python script and adding ssh keys, is fully automated via Ansible playbooks
|
|
|
|
Adding a new server to be monitored is easily achieved via the porygon-management.sh CLI tool written in Bash
|
|
|
|
## High Level Architecture Overview
|
|
|
|
```
|
|
Cron starts scraper.py every 15 minutes
|
|
↓
|
|
For each monitored server
|
|
↓
|
|
Attempt to reach via ICMP
|
|
/ \
|
|
SUCCESS FAILURE
|
|
↓ ↓
|
|
Check previous state Check previous state
|
|
↓ ↓
|
|
Previously offline? Previously online?
|
|
/ \ / \
|
|
YES NO YES NO
|
|
↓ ↓ ↓ ↓
|
|
Send "back Continue Send Continue
|
|
online" email "offline" email
|
|
\ / \ /
|
|
└───────┬───────────────┴──────────┘
|
|
↓
|
|
If server is pingable
|
|
↓
|
|
Connect via dedicated SSH key
|
|
as restricted user
|
|
↓
|
|
Run collector.py to scrape metrics
|
|
↓
|
|
Collector generates JSON
|
|
↓
|
|
Copy JSON back via SFTP
|
|
↓
|
|
Store in appropriate Apache server directory
|
|
↓
|
|
index.html reads JSON
|
|
↓
|
|
Metrics displayed in web portal
|
|
↓
|
|
Save current online/offline server state to JSON
|
|
```
|
|
|
|
## Monitoring Failover
|
|
|
|
I have a secondary Debian LXC container on a separate hypervisor host to provide monitoring redundancy
|
|
|
|
It is scheduled via Cron to attempt to ping Apache-Intranet every 5 minutes
|
|
|
|
If Apache-Intranet, (the primary), is unreachable it takes over monitoring/alerting duties, otherwise it lies dormant
|
|
|
|
Its purpose is to provide email alerts to me informing that we are currently in the midst of an outage and which servers are offline
|
|
|
|
```
|
|
┌──────────────────────────────────────────┐
|
|
│ Secondary Monitoring LXC │
|
|
│ Runs ping.py every 5 minutes which │
|
|
│ checks Apache-Intranet's health via ICMP │
|
|
└──────────────────────────────────────────┘
|
|
│
|
|
Is primary reachable?
|
|
/ \
|
|
YES NO
|
|
↓ ↓
|
|
Do nothing Take over
|
|
↓
|
|
Begin monitoring servers' reachability
|
|
and sending alerts
|
|
```
|
|
|
|
## Images
|
|
|
|

|
|
|
|
(A green cicle indicates online, a black offline)
|
|
|
|
|
|
|
|
(Example of metrics gathered and displayed page) |